L'interpréteur de tests A/B : Lancer, Maintenir ou Abandonner en un seul Prompt
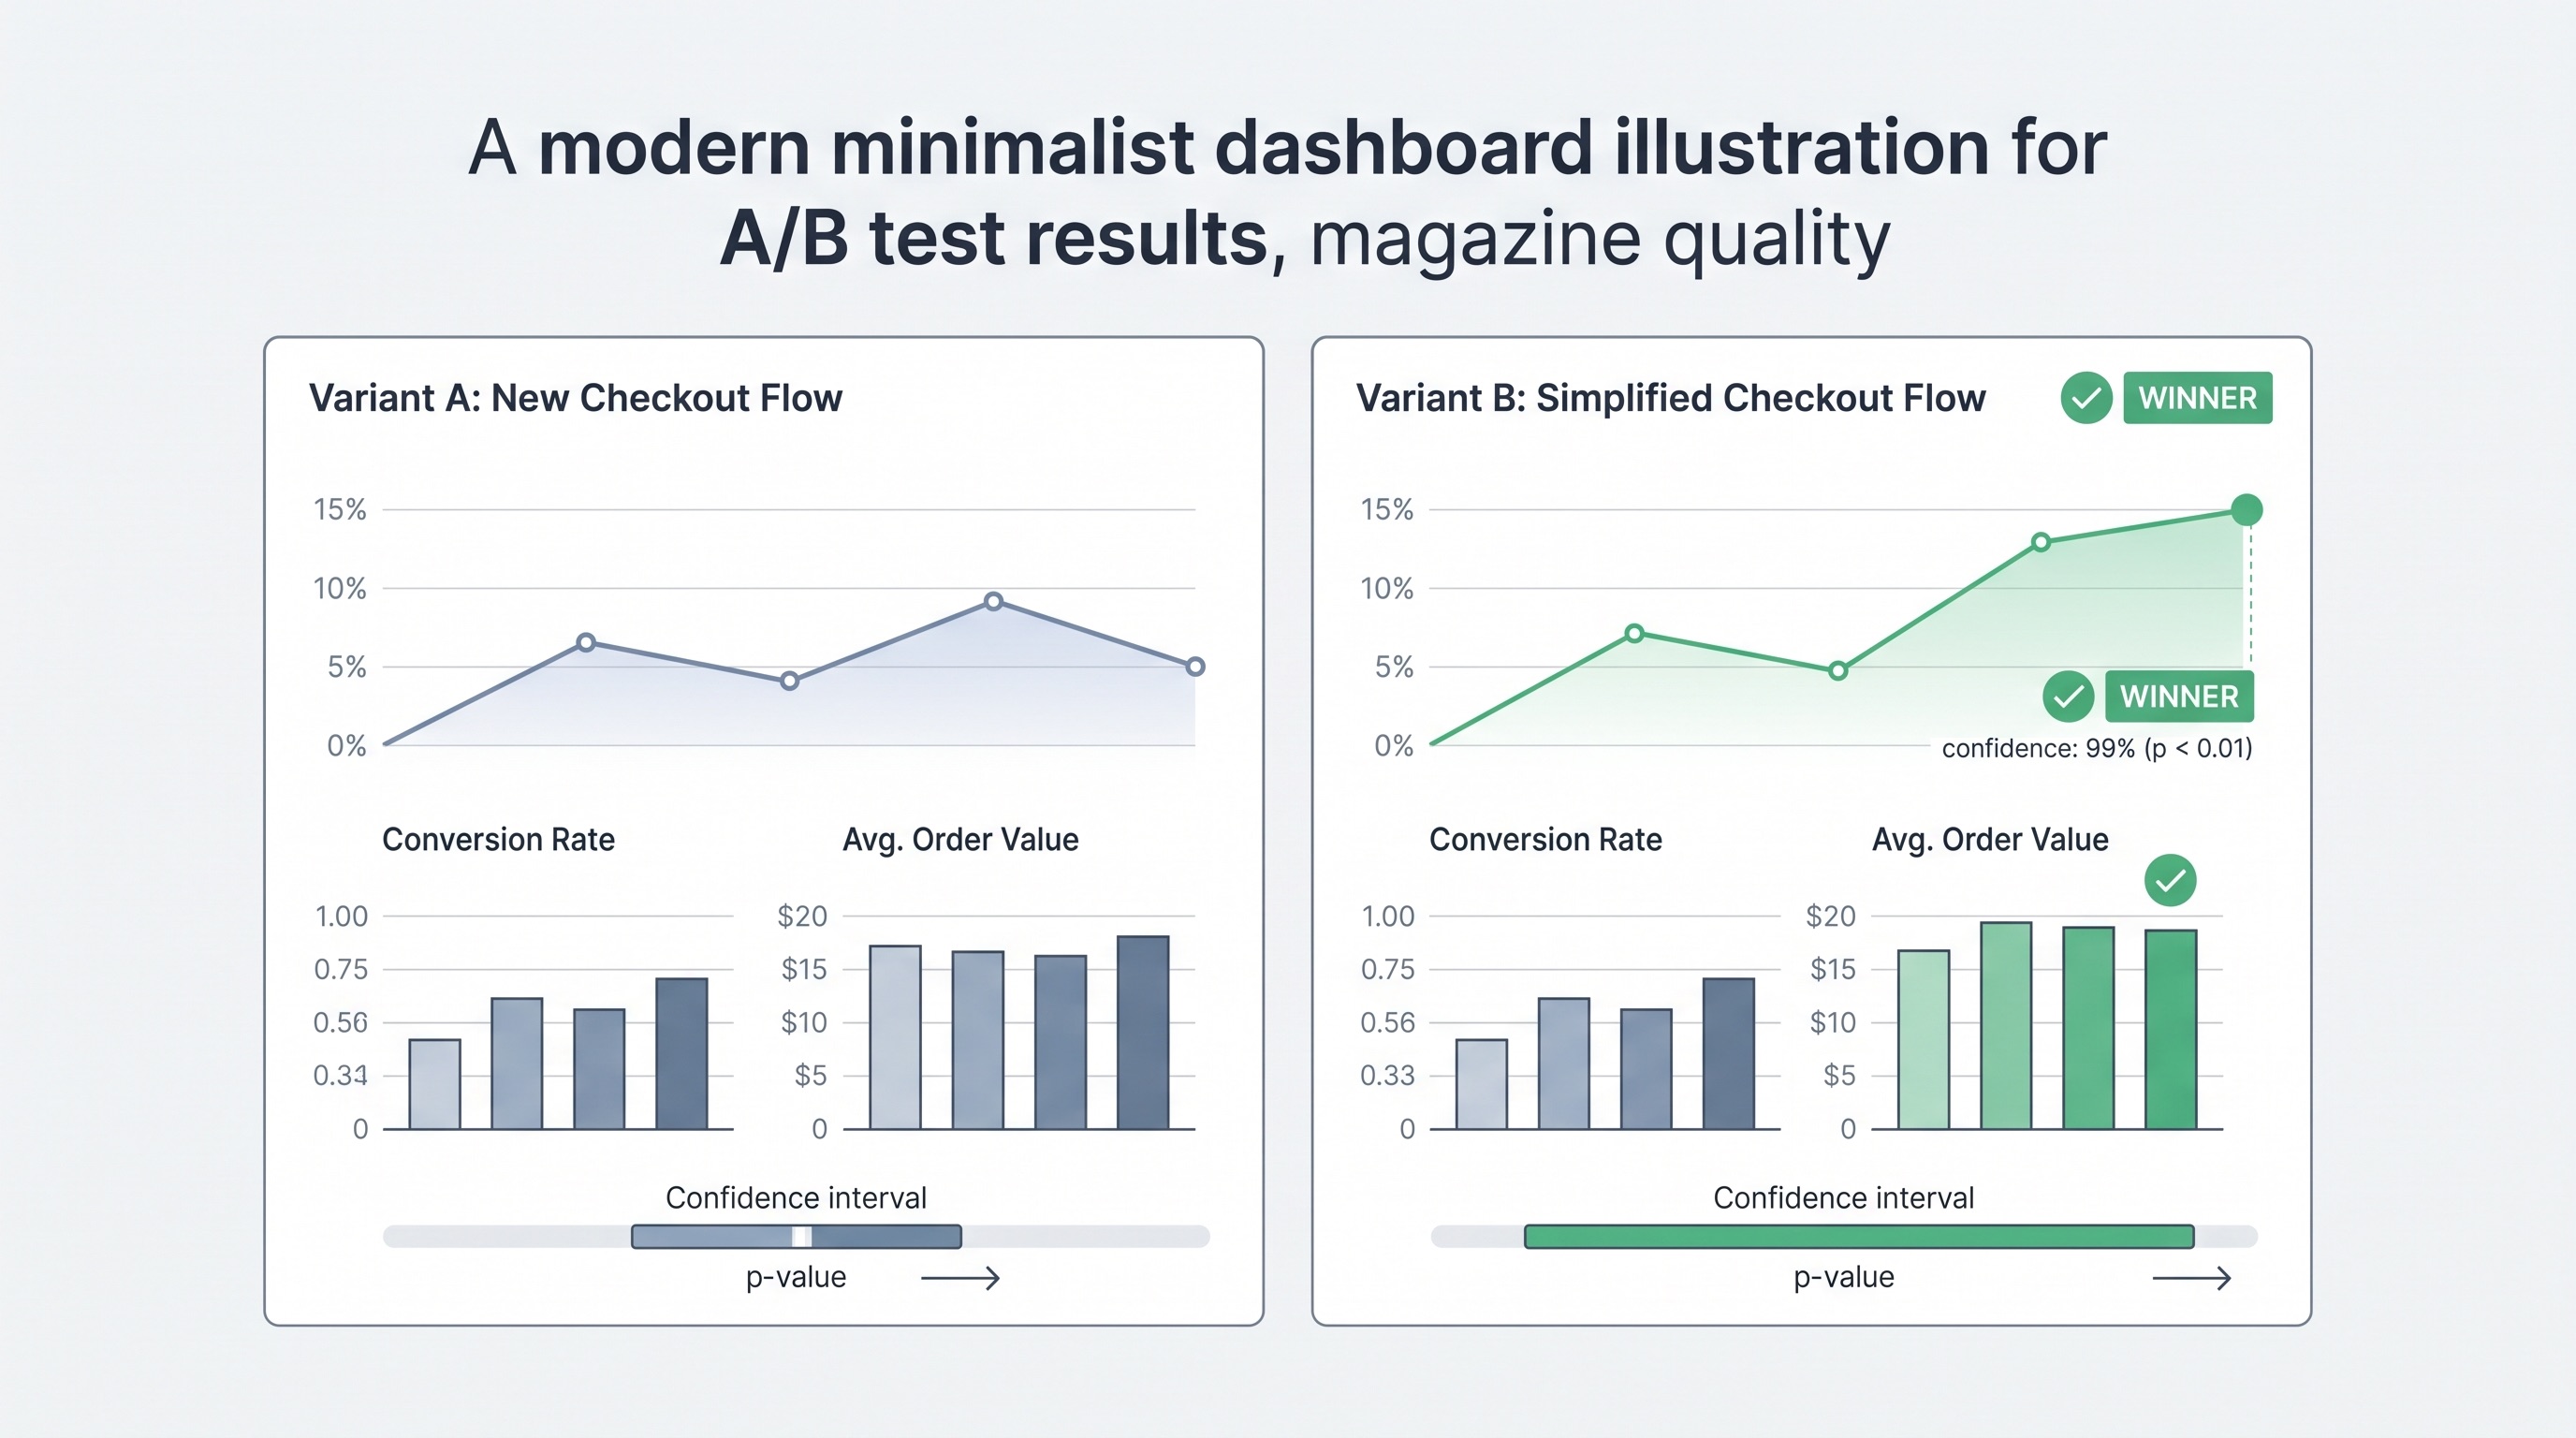
Pourquoi ce prompt est important
Bad ship/kill calls are expensive in both directions. Shipping a false positive locks in code that looks like a winner in the dashboard but quietly erodes revenue for months before anyone traces it back to the test. Killing a real winner because the raw numbers looked shaky under-delivers growth you already earned. And teams that 'peek' at results early and stop tests as soon as the trend looks good introduce a well-documented bias that inflates the apparent win rate of every experiment program — this prompt forces a power and significance check before any of that can happen.
À quoi nous l'utilisons
You're a growth PM and your two-week checkout redesign A/B test just wrapped. Leadership wants a ship/no-ship call in tomorrow's roadmap review, but the raw dashboard just shows a conversion rate that went up — it doesn't tell you if that's a real 5% lift or noise that will vanish next month, and nobody on the team has time to run the statistics by hand before the meeting.
Prompt
Act as a senior product analyst and growth data scientist with deep expertise in experimental design and statistical inference for digital products.

CONTEXT:
I ran an A/B test with the following setup:
- Test name / hypothesis: [TEST NAME/HYPOTHESIS]
- Primary success metric: [PRIMARY SUCCESS METRIC]
- Control group result: [CONTROL METRIC AND VALUE]
- Variant group result: [VARIANT METRIC AND VALUE]
- Sample sizes: [SAMPLE SIZES] (control vs. variant)
- Test duration: [TEST DURATION]
- Guardrail metrics tracked (if any): [GUARDRAIL METRICS, IF ANY]
- Any other context (traffic source, platform, seasonality, known anomalies): [ADDITIONAL CONTEXT]

TASK:
Analyze this experiment and produce a ship/hold/kill recommendation. Your analysis must:
1. Calculate or estimate statistical significance (p-value or confidence interval) for the primary metric given the sample sizes provided.
2. Assess statistical power — flag explicitly if the sample size is too small to trust the result either way.
3. Distinguish statistical significance from practical/business significance — a "significant" result that moves the needle by a trivial amount is not a reason to ship.
4. Check the guardrail metrics for regressions, even if the primary metric looks like a win.
5. Give a clear final recommendation: SHIP, HOLD (extend test), or KILL — with your reasoning stated in plain terms a non-technical stakeholder can follow.

CONSTRAINTS:
- Do NOT recommend shipping on a result that is underpowered — say so explicitly and recommend the minimum additional sample size or duration needed instead.
- Explicitly flag possible novelty effects if the test ran less than 2 full business cycles (e.g., under 2 weeks for a weekly-cadence product).
- Explicitly flag risk of "peeking" bias if the numbers suggest the test may have been stopped early based on interim results.
- Never conflate correlation from a single test with certainty — mention confounding variables if the context suggests any (seasonality, traffic mix changes, etc.).
- Keep the tone direct and decision-oriented — this is going into a roadmap review, not a stats textbook.

OUTPUT FORMAT:
## Statistical Read
[Confidence interval / p-value, power assessment, in plain language]

## Business Interpretation
[What this actually means for the product and the metric that matters]

## Recommendation: [SHIP / HOLD / KILL]
[2-3 sentence justification]

## Caveats & Follow-Up
[1-2 risks or suggested follow-up tests]
Résultat
Scenario: Checkout flow redesign test, e-commerce site, 14-day run.
Statistical Read
Control: 4.8% conversion (n=24,600 sessions). Variant: 5.05% conversion (n=24,450 sessions). That's a +5.2% relative lift. Running a two-proportion z-test on these numbers gives a p-value of approximately 0.041 — just inside the conventional 0.05 significance threshold, with a 95% confidence interval on the lift of roughly [+0.1%, +10.3%] relative. Post-hoc power at this effect size and sample size lands around 52%, well below the 80% threshold you'd want for a decision this consequential. In plain terms: the result is nominally significant, but the confidence interval is wide enough that the "true" lift could be barely above zero or as high as 10% — you don't have enough data to know which.
Business Interpretation
A +5.2% relative lift on checkout conversion is commercially meaningful if real — at your traffic volume that's roughly 60 incremental orders per day. But the wide confidence interval means you're not choosing between "ship" and "don't ship," you're choosing between "possibly a strong winner" and "possibly noise." The guardrail metric (average order value) held flat at -0.3% (not significant), so there's no evidence the variant is cannibalizing basket size to win on conversion rate. No red flags there.
Recommendation: HOLD
Extend the test by at least 7-10 more days to reach ~80% power at the observed effect size (approximately 34,000 sessions per arm). The 14-day window also only covers two weekly cycles, borderline for ruling out a novelty effect on a redesigned flow — extending the window addresses both the power problem and the novelty-effect risk simultaneously. Shipping now on a 52%-powered result risks locking in a false positive that erodes checkout conversion once the novelty wears off.
Caveats & Follow-Up
Check whether the lift is concentrated in mobile vs. desktop traffic — redesigns often show device-specific effects that average out misleadingly. Also confirm the test wasn't peeked at and stopped early; if the 14-day window was chosen after seeing early results trending positive, treat this read with additional skepticism and weight the extension recommendation even more heavily.
La plupart des équipes lisent un résultat de test A/B de la même manière : nombre du groupe de contrôle, nombre du groupe variant, le plus élevé gagne. C'est ainsi que des faux positifs sont déployés et que de vrais gagnants sont tués par des parties prenantes nerveuses qui voient un petit échantillon et prennent peur. Ce Prompt existe pour imposer cinq vérifications qu'un coup d'œil au tableau de bord ignore — significativité, puissance, significativité pratique, régressions des métriques de garde-fou et risques de biais comme les effets de nouveauté et le picorage précoce — avant que quiconque ne s'engage sur une décision de lancer, maintenir ou abandonner.
Pourquoi la structure fonctionne
La section Contexte demande délibérément les tailles d'échantillon et la durée du test dès le départ, et pas seulement les métriques principales. Les calculs de significativité et de puissance n'ont aucun sens sans elles, et c'est exactement l'information que la plupart des gens omettent lorsqu'ils collent « le contrôle était à 4,8 %, le variant à 5,05 % » dans une fenêtre de discussion en attendant un verdict.
La section Contraintes est là où se trouve la vraie valeur. Interdire explicitement une recommandation de « lancer » sur un résultat sous-puissant arrête le mode d'échec le plus courant : un test qui a atteint une significativité nominale (p juste en dessous de 0,05) mais qui n'a jamais été exécuté assez longtemps pour atteindre une taille d'échantillon fiable. Le signalement d'effet de nouveauté repère les refontes et les changements d'interface qui font grimper une métrique temporairement parce que les utilisateurs réagissent à quelque chose de nouveau, non parce que le changement est réellement meilleur — une distinction qui n'apparaît que si le test dure assez longtemps pour couvrir plusieurs cycles d'utilisation complets. Le signalement de biais de picorage précoce aborde un piège statistique bien connu : les équipes qui vérifient les résultats quotidiennement et arrêtent le test dès qu'il semble bon exécutent en fait des dizaines de tests d'hypothèses cachés, ce qui gonfle le taux de faux positifs bien au-dessus des 5 % nominaux.
La section Format de sortie sépare intentionnellement la « Lecture statistique » de l'« Interprétation métier ». Une valeur p de 0,03 ne signifie rien pour un VP lors d'une revue de feuille de route — mais « il y a une vraie chance que cette hausse soit proche de zéro » signifie quelque chose. Séparer les deux force le modèle à traduire les statistiques en une phrase utilisable pour la décision au lieu de s'arrêter au chiffre.
Comment bien l'utiliser
Remplissez les champs entre crochets directement depuis l'exportation de votre plateforme d'expérimentation — n'arrondissez pas les nombres à la main, car le calcul de la puissance dépend des tailles d'échantillon réelles. Si vous n'avez pas de métrique de garde-fou formelle définie, écrivez « aucune suivie » plutôt que de laisser vide — ce vide mérite lui-même d'être signalé dans la sortie, car lancer sur une seule métrique sans vérifications des risques secondaires est un risque en soi.