مفسر آزمون A/B: راهاندازی، مدیریت یا لغو با یک Prompt
چرا این پرامپت اهمیت دارد
Bad ship/kill calls are expensive in both directions. Shipping a false positive locks in code that looks like a winner in the dashboard but quietly erodes revenue for months before anyone traces it back to the test. Killing a real winner because the raw numbers looked shaky under-delivers growth you already earned. And teams that 'peek' at results early and stop tests as soon as the trend looks good introduce a well-documented bias that inflates the apparent win rate of every experiment program — this prompt forces a power and significance check before any of that can happen.
ما از آن برای چه استفاده میکنیم
You're a growth PM and your two-week checkout redesign A/B test just wrapped. Leadership wants a ship/no-ship call in tomorrow's roadmap review, but the raw dashboard just shows a conversion rate that went up — it doesn't tell you if that's a real 5% lift or noise that will vanish next month, and nobody on the team has time to run the statistics by hand before the meeting.
پرامپت
Act as a senior product analyst and growth data scientist with deep expertise in experimental design and statistical inference for digital products.

CONTEXT:
I ran an A/B test with the following setup:
- Test name / hypothesis: [TEST NAME/HYPOTHESIS]
- Primary success metric: [PRIMARY SUCCESS METRIC]
- Control group result: [CONTROL METRIC AND VALUE]
- Variant group result: [VARIANT METRIC AND VALUE]
- Sample sizes: [SAMPLE SIZES] (control vs. variant)
- Test duration: [TEST DURATION]
- Guardrail metrics tracked (if any): [GUARDRAIL METRICS, IF ANY]
- Any other context (traffic source, platform, seasonality, known anomalies): [ADDITIONAL CONTEXT]

TASK:
Analyze this experiment and produce a ship/hold/kill recommendation. Your analysis must:
1. Calculate or estimate statistical significance (p-value or confidence interval) for the primary metric given the sample sizes provided.
2. Assess statistical power — flag explicitly if the sample size is too small to trust the result either way.
3. Distinguish statistical significance from practical/business significance — a "significant" result that moves the needle by a trivial amount is not a reason to ship.
4. Check the guardrail metrics for regressions, even if the primary metric looks like a win.
5. Give a clear final recommendation: SHIP, HOLD (extend test), or KILL — with your reasoning stated in plain terms a non-technical stakeholder can follow.

CONSTRAINTS:
- Do NOT recommend shipping on a result that is underpowered — say so explicitly and recommend the minimum additional sample size or duration needed instead.
- Explicitly flag possible novelty effects if the test ran less than 2 full business cycles (e.g., under 2 weeks for a weekly-cadence product).
- Explicitly flag risk of "peeking" bias if the numbers suggest the test may have been stopped early based on interim results.
- Never conflate correlation from a single test with certainty — mention confounding variables if the context suggests any (seasonality, traffic mix changes, etc.).
- Keep the tone direct and decision-oriented — this is going into a roadmap review, not a stats textbook.

OUTPUT FORMAT:
## Statistical Read
[Confidence interval / p-value, power assessment, in plain language]

## Business Interpretation
[What this actually means for the product and the metric that matters]

## Recommendation: [SHIP / HOLD / KILL]
[2-3 sentence justification]

## Caveats & Follow-Up
[1-2 risks or suggested follow-up tests]
نتیجه
Scenario: Checkout flow redesign test, e-commerce site, 14-day run.
Statistical Read
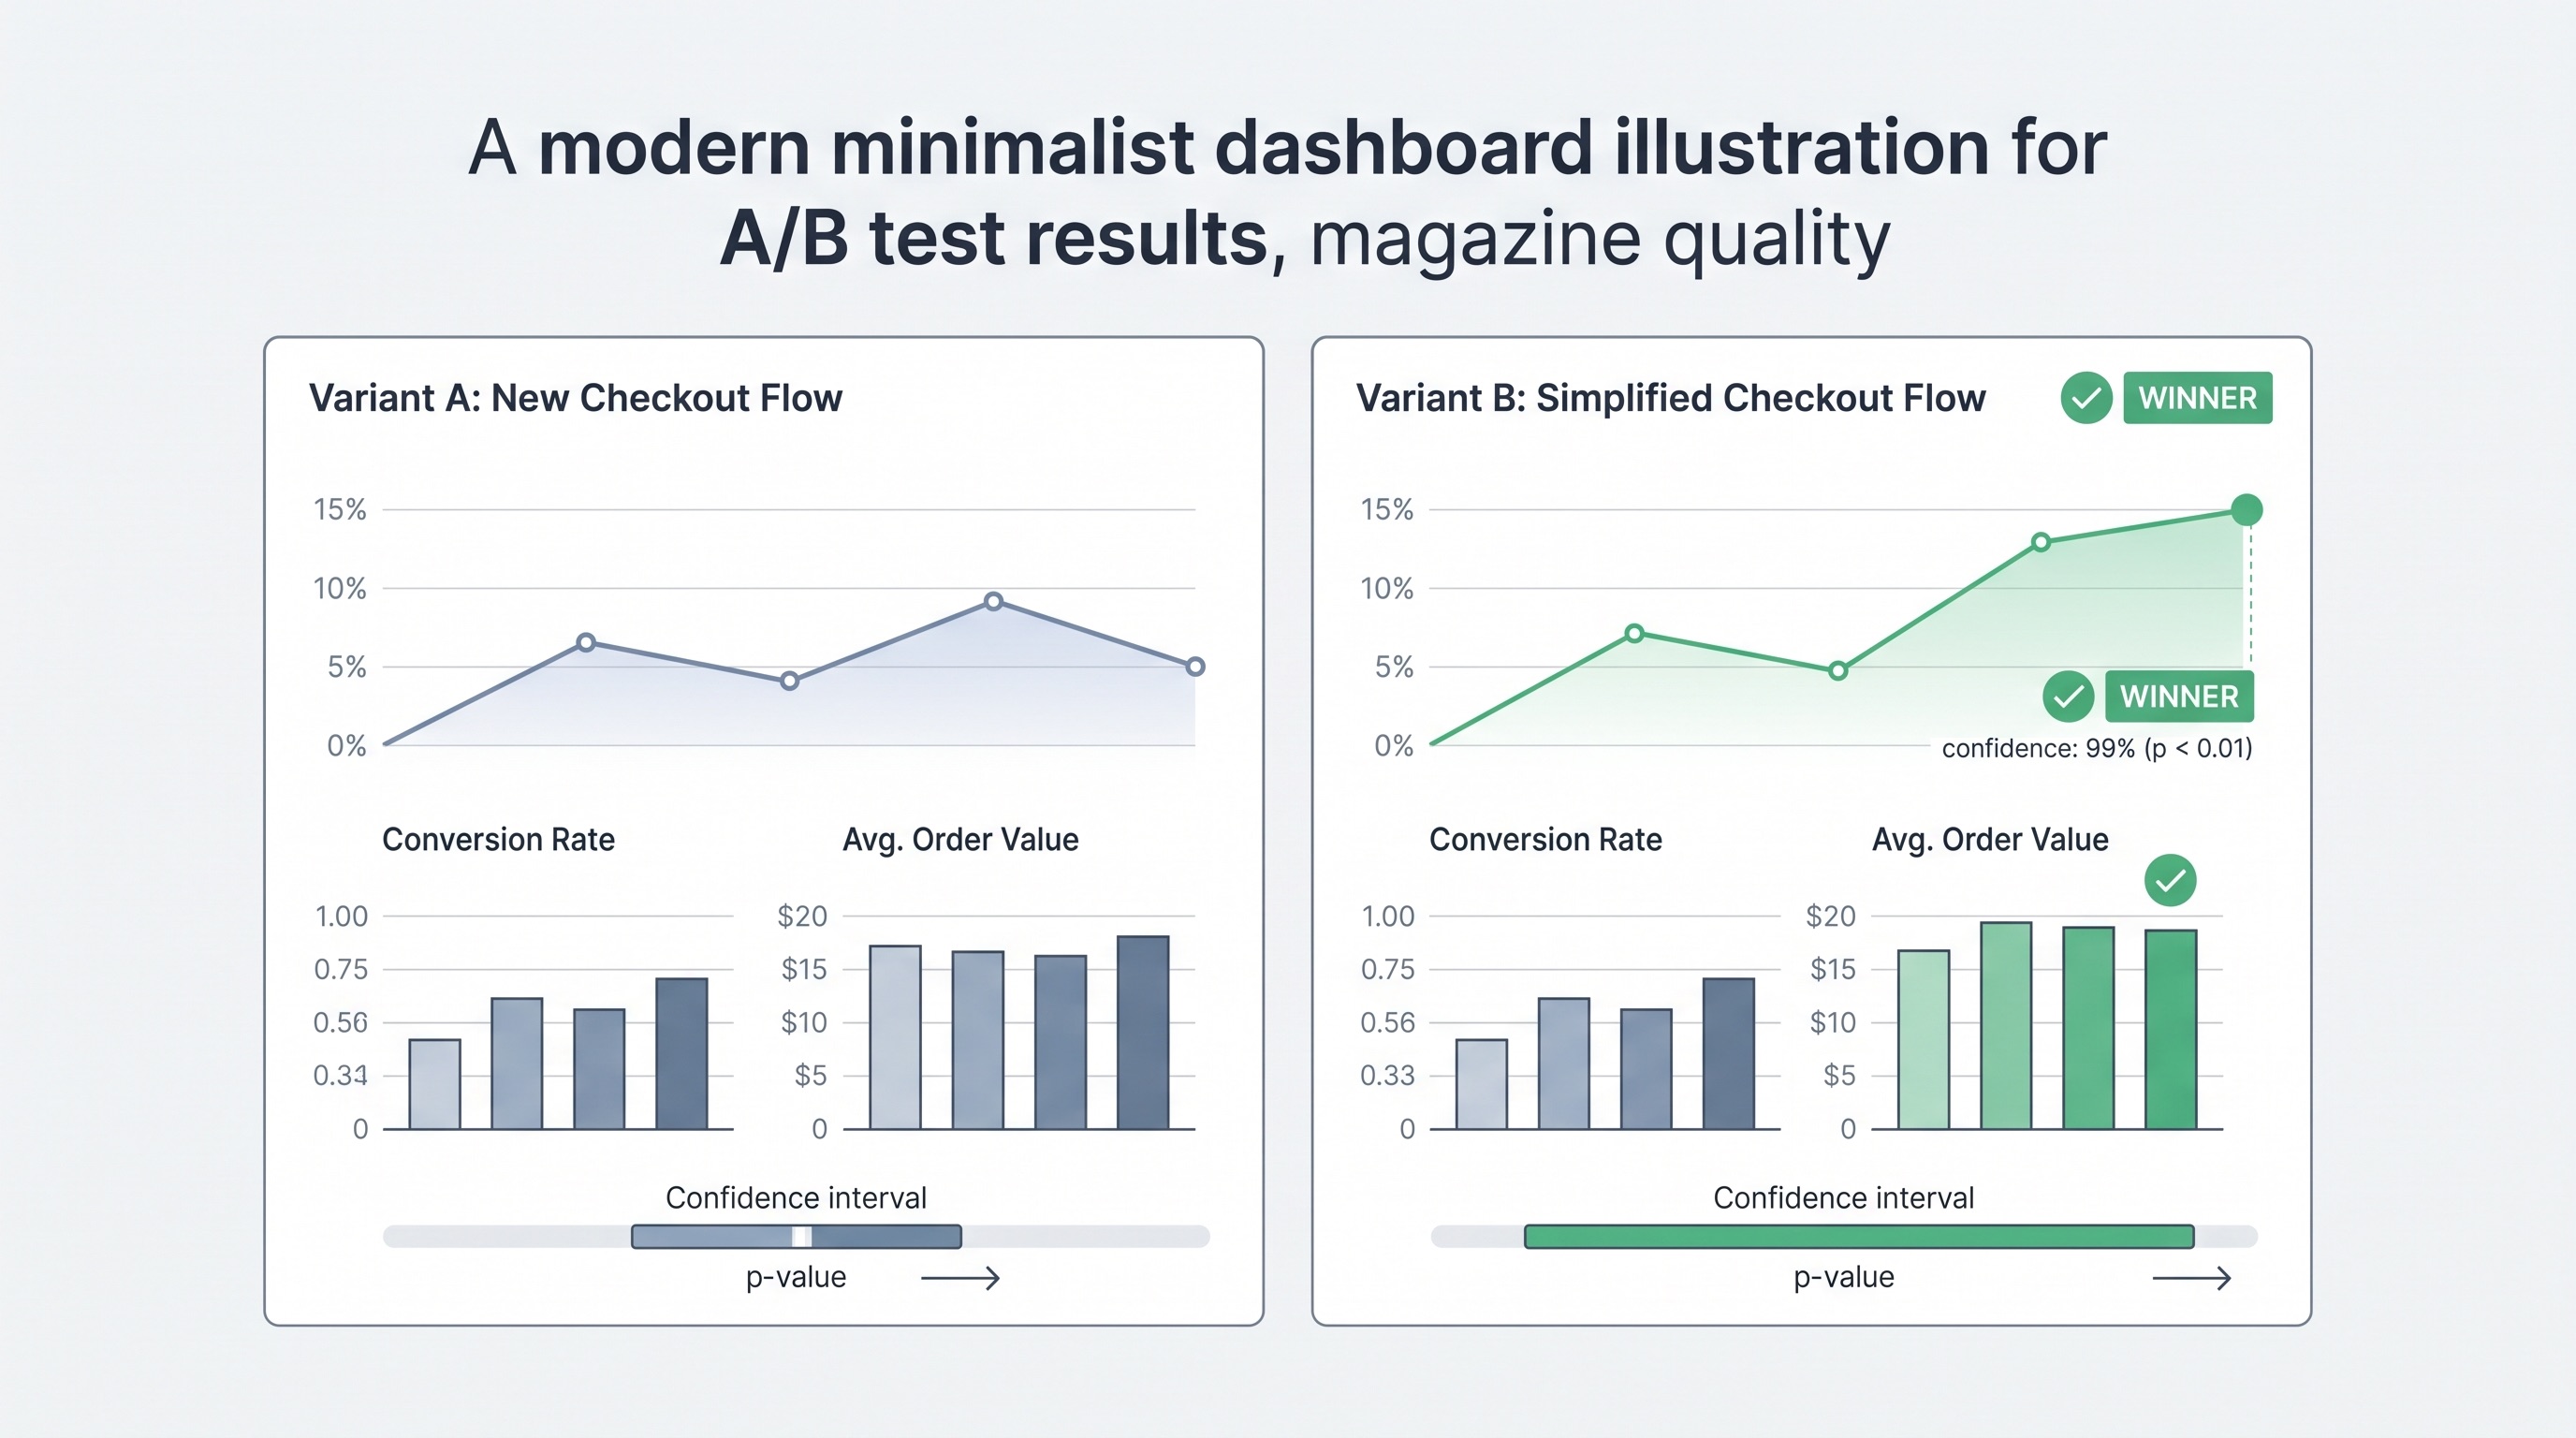
Control: 4.8% conversion (n=24,600 sessions). Variant: 5.05% conversion (n=24,450 sessions). That's a +5.2% relative lift. Running a two-proportion z-test on these numbers gives a p-value of approximately 0.041 — just inside the conventional 0.05 significance threshold, with a 95% confidence interval on the lift of roughly [+0.1%, +10.3%] relative. Post-hoc power at this effect size and sample size lands around 52%, well below the 80% threshold you'd want for a decision this consequential. In plain terms: the result is nominally significant, but the confidence interval is wide enough that the "true" lift could be barely above zero or as high as 10% — you don't have enough data to know which.
Business Interpretation
A +5.2% relative lift on checkout conversion is commercially meaningful if real — at your traffic volume that's roughly 60 incremental orders per day. But the wide confidence interval means you're not choosing between "ship" and "don't ship," you're choosing between "possibly a strong winner" and "possibly noise." The guardrail metric (average order value) held flat at -0.3% (not significant), so there's no evidence the variant is cannibalizing basket size to win on conversion rate. No red flags there.
Recommendation: HOLD
Extend the test by at least 7-10 more days to reach ~80% power at the observed effect size (approximately 34,000 sessions per arm). The 14-day window also only covers two weekly cycles, borderline for ruling out a novelty effect on a redesigned flow — extending the window addresses both the power problem and the novelty-effect risk simultaneously. Shipping now on a 52%-powered result risks locking in a false positive that erodes checkout conversion once the novelty wears off.
Caveats & Follow-Up
Check whether the lift is concentrated in mobile vs. desktop traffic — redesigns often show device-specific effects that average out misleadingly. Also confirm the test wasn't peeked at and stopped early; if the 14-day window was chosen after seeing early results trending positive, treat this read with additional skepticism and weight the extension recommendation even more heavily.
بیشتر تیمها نتیجه آزمون A/B را به یک شکل میخوانند: عدد گروه کنترل، عدد گروه آزمایش — هر کدام بالاتر باشد برنده است. همین رویکرد است که باعث میشود نتایج مثبت کاذب راهاندازی شوند و برندگان واقعی توسط ذینفعان نگران — که با دیدن حجم نمونه کم دچار تردید شدهاند — کنار گذاشته شوند. این Prompt برای انجام پنج بررسی طراحی شده که نگاه سطحی به داشبورد از آنها غافل میماند: اهمیت آماری، توان، اهمیت عملی، پسرفت معیارهای محافظ، و سوگیریهایی مانند اثر تازگی و نگاه زودهنگام — پیش از آنکه تیم به تصمیم راهاندازی، نگهداری یا لغو متعهد شود.
چرا این ساختار کار میکند
بخش زمینه عمداً اندازه نمونه و مدت زمان آزمون را پیش از معیارهای اصلی میخواهد. محاسبات اهمیت آماری و توان بدون این دو بیمعنیاند و این دقیقاً همان اطلاعاتی است که بیشتر افراد هنگامی که عبارتی مثل «کنترل ۴.۸٪ بود، آزمایش ۵.۰۵٪» را برای گرفتن نظر در یک پنجره گفتگو میچسبانند، از قلم میاندازند.
بخش محدودیتها جایی است که ارزش واقعی نهفته است. ممنوعیت صریح توصیه به «راهاندازی» برای نتیجهای با توان ناکافی، رایجترین الگوی شکست را خنثی میکند: آزمونی که به معناداری اسمی رسیده (p کمی زیر ۰.۰۵) اما هرگز به اندازه کافی برای رسیدن به حجم نمونه قابل اعتماد اجرا نشده است. پرچم اثر تازگی، بازطراحیها و تغییرات UI را علامتگذاری میکند که بهطور موقت معیاری را بالا میبرند — چون کاربران به چیزی تازه واکنش نشان میدهند، نه به این دلیل که تغییر واقعاً بهتر است؛ تمایزی که تنها در صورتی آشکار میشود که آزمون به اندازه کافی برای پوشش چند چرخه کامل استفاده اجرا شود. پرچم سوگیری نگاه زودهنگام به یک دام آماری شناختهشده اشاره دارد: تیمهایی که روزانه نتایج را بررسی میکنند و به محض خوب به نظر رسیدن آزمون آن را متوقف میکنند، عملاً دهها آزمون فرضیه پنهان اجرا میکنند که نرخ مثبت کاذب را بسیار فراتر از ۵٪ اسمی میبرد.
بخش قالب خروجی عمداً «خوانش آماری» را از «تفسیر تجاری» جدا میکند. مقدار p برابر ۰.۰۳ برای یک معاون در بررسی نقشه راه معنایی ندارد — اما «شانس واقعی وجود دارد که این افزایش نزدیک به صفر باشد» معنا دارد. این جداسازی، مدل را وادار میکند آمار را به جملهای قابل استفاده برای تصمیم تبدیل کند، نه اینکه تنها به عدد بسنده کند.
چگونه از آن به خوبی استفاده کنیم
فیلدهای داخل کروشه را مستقیماً از خروجی پلتفرم آزمایش خود پر کنید — اعداد را دستی گرد نکنید، زیرا محاسبه توان به اندازههای واقعی نمونه وابسته است. اگر معیار محافظ رسمی تعریف نکردهاید، به جای خالی گذاشتن آن، «هیچکدام ردیابی نشده» بنویسید — همان شکاف خود نکتهای قابل اشاره در خروجی است، زیرا راهاندازی بر اساس یک معیار واحد بدون بررسیهای جانبی، ریسک جداگانهای دارد.