Funding rates, not spot prices, are driving crypto's violent liquidation cascades
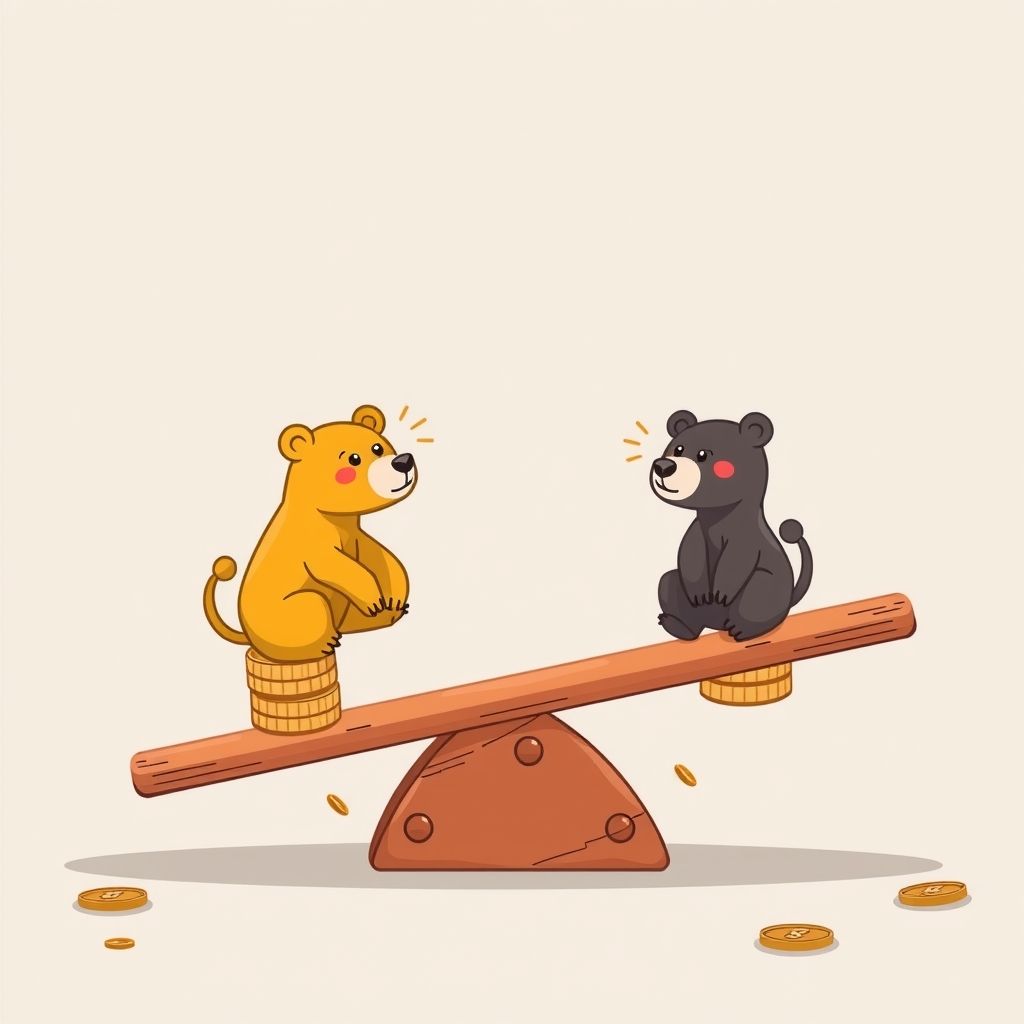
When $52 million in leveraged crypto positions evaporated in a 10-minute window over a recent weekend, most coverage framed it as a story about price: some bad news hit, people panicked, prices fell. That framing misses the actual mechanism. In modern crypto markets, perpetual futures funding rates — not spot prices — are usually the proximate trigger for these violent, fast liquidation cascades, and understanding why changes how you should read volatility.
A perpetual futures contract, or "perp," is a derivative that tracks an asset's price indefinitely, with no expiry date. Because it never settles, exchanges need a mechanism to keep the perp's price tethered to the actual spot price of the underlying asset. That mechanism is the funding rate: a periodic payment, typically every 1 to 8 hours, exchanged directly between traders holding long and short positions. When perps trade above spot — meaning more traders are betting the price will rise — longs pay shorts. When perps trade below spot, shorts pay longs. The rate adjusts constantly to pull the perp price back toward spot.
Why funding rates become a feedback loop
In calm markets, funding rates sit close to zero and nobody notices them. The problem emerges when sentiment becomes lopsided. If 80% of open interest on a token is long, exchanges push funding rates sharply positive to incentivize shorts and cool the imbalance. But highly leveraged longs — traders using 20x, 50x, even 100x leverage on some platforms — are often paying funding costs they can't sustain for long. A sustained positive funding rate of even 0.1% paid every 8 hours works out to roughly 11% annualized, which erodes a leveraged position's margin cushion day after day even if the price doesn't move at all.
This is the setup for a cascade. A modest price dip that would be a non-event in spot markets instead pushes thousands of over-leveraged long positions below their maintenance margin simultaneously. Exchanges automatically liquidate those positions by selling into the market, which pushes the price down further, which triggers the next tier of liquidations. The entire sequence — from the initial trigger to tens of millions of dollars of forced selling — can complete in minutes, because it is mechanical and automated, not driven by human decision-making at each step.
Funding rate as a leading indicator, not a lagging one
This is the part retail traders consistently get backwards. By the time a cascade is visible on a price chart, it's already happening — there's no edge in reacting to the candle. But funding rates are visible continuously on every major perpetual exchange (Binance, Bybit, OKX, dYdX, Hyperliquid) and tend to spike well before a cascade, because the imbalance that causes a cascade is the same imbalance that pushes funding rates to extremes. A funding rate persistently above 0.05% per 8-hour period on a major pair is a reasonable signal that long positioning has become crowded and fragile, independent of what price is doing.
Several data providers now track "funding rate heatmaps" across exchanges and tokens specifically because this correlation is reliable enough to trade around. Coinglass and Laevitas both publish free, continuously updated funding rate dashboards. The pattern repeats on both sides: extreme negative funding rates (shorts paying longs heavily) have preceded violent short squeezes just as reliably as extreme positive funding has preceded long liquidation cascades.
Open interest is the other half of the picture
Funding rate alone isn't sufficient — a high funding rate on low open interest is a minor curiosity, not a risk signal. The dangerous combination is high funding rate plus high open interest relative to the token's typical trading volume. Open interest measures the total value of outstanding, unsettled derivative contracts. When open interest on a token's perpetual contracts exceeds roughly 3-5% of its daily spot trading volume, the derivatives market has effectively outgrown the spot market's ability to absorb forced liquidations without significant price impact. That mismatch is what turns a 3% price dip into a 15% crash: the spot order book simply isn't deep enough to absorb the selling that automated liquidations dump into it.
This is why liquidation cascades hit mid-cap altcoins far harder, proportionally, than Bitcoin or Ethereum. BTC and ETH have spot markets deep enough to absorb most liquidation waves without catastrophic slippage. A token with a few hundred million dollars in market cap and a thin spot order book can see open interest many multiples of its daily volume, which is the exact condition that produces 90% single-candle wicks.
What this means in practice
For anyone trading or holding leveraged crypto positions, three concrete habits follow from this mechanism:
- Check funding rate before checking price. A sustained funding rate above 0.05-0.1% per 8-hour interval on your position's direction is a cost that compounds against you daily and a signal that a reversal or liquidation wave is statistically more likely, regardless of your own thesis about the asset.
- Cross-reference open interest against spot volume. If a token's total open interest across major exchanges exceeds 5% of its 24-hour spot volume, treat any position in it — long or short — as exposed to outsized cascade risk, and size accordingly.
- Treat sudden, sharp wicks with no news catalyst as liquidation cascades, not information events. If a 10-15% move happens in minutes with no corresponding headline, it is far more likely to be a derivatives-driven cascade unwinding than new information being priced in — and cascades mean-revert faster than genuine repricings, which has direct implications for whether you should chase or fade the move.
The next time a crypto headline reads "$50 million liquidated in minutes," the real story isn't the dollar figure — it's that funding rates and open interest ratios had already been flashing the setup for days beforehand, visible to anyone checking the right dashboard instead of the price chart.