Der A/B-Test-Interpreter: Starten, Halten oder Verwerfen in einem Prompt
Warum dieser Prompt wichtig ist
Bad ship/kill calls are expensive in both directions. Shipping a false positive locks in code that looks like a winner in the dashboard but quietly erodes revenue for months before anyone traces it back to the test. Killing a real winner because the raw numbers looked shaky under-delivers growth you already earned. And teams that 'peek' at results early and stop tests as soon as the trend looks good introduce a well-documented bias that inflates the apparent win rate of every experiment program — this prompt forces a power and significance check before any of that can happen.
Wofür wir ihn verwenden
You're a growth PM and your two-week checkout redesign A/B test just wrapped. Leadership wants a ship/no-ship call in tomorrow's roadmap review, but the raw dashboard just shows a conversion rate that went up — it doesn't tell you if that's a real 5% lift or noise that will vanish next month, and nobody on the team has time to run the statistics by hand before the meeting.
Prompt
Act as a senior product analyst and growth data scientist with deep expertise in experimental design and statistical inference for digital products.

CONTEXT:
I ran an A/B test with the following setup:
- Test name / hypothesis: [TEST NAME/HYPOTHESIS]
- Primary success metric: [PRIMARY SUCCESS METRIC]
- Control group result: [CONTROL METRIC AND VALUE]
- Variant group result: [VARIANT METRIC AND VALUE]
- Sample sizes: [SAMPLE SIZES] (control vs. variant)
- Test duration: [TEST DURATION]
- Guardrail metrics tracked (if any): [GUARDRAIL METRICS, IF ANY]
- Any other context (traffic source, platform, seasonality, known anomalies): [ADDITIONAL CONTEXT]

TASK:
Analyze this experiment and produce a ship/hold/kill recommendation. Your analysis must:
1. Calculate or estimate statistical significance (p-value or confidence interval) for the primary metric given the sample sizes provided.
2. Assess statistical power — flag explicitly if the sample size is too small to trust the result either way.
3. Distinguish statistical significance from practical/business significance — a "significant" result that moves the needle by a trivial amount is not a reason to ship.
4. Check the guardrail metrics for regressions, even if the primary metric looks like a win.
5. Give a clear final recommendation: SHIP, HOLD (extend test), or KILL — with your reasoning stated in plain terms a non-technical stakeholder can follow.

CONSTRAINTS:
- Do NOT recommend shipping on a result that is underpowered — say so explicitly and recommend the minimum additional sample size or duration needed instead.
- Explicitly flag possible novelty effects if the test ran less than 2 full business cycles (e.g., under 2 weeks for a weekly-cadence product).
- Explicitly flag risk of "peeking" bias if the numbers suggest the test may have been stopped early based on interim results.
- Never conflate correlation from a single test with certainty — mention confounding variables if the context suggests any (seasonality, traffic mix changes, etc.).
- Keep the tone direct and decision-oriented — this is going into a roadmap review, not a stats textbook.

OUTPUT FORMAT:
## Statistical Read
[Confidence interval / p-value, power assessment, in plain language]

## Business Interpretation
[What this actually means for the product and the metric that matters]

## Recommendation: [SHIP / HOLD / KILL]
[2-3 sentence justification]

## Caveats & Follow-Up
[1-2 risks or suggested follow-up tests]
Ergebnis
Scenario: Checkout flow redesign test, e-commerce site, 14-day run.
Statistical Read
Control: 4.8% conversion (n=24,600 sessions). Variant: 5.05% conversion (n=24,450 sessions). That's a +5.2% relative lift. Running a two-proportion z-test on these numbers gives a p-value of approximately 0.041 — just inside the conventional 0.05 significance threshold, with a 95% confidence interval on the lift of roughly [+0.1%, +10.3%] relative. Post-hoc power at this effect size and sample size lands around 52%, well below the 80% threshold you'd want for a decision this consequential. In plain terms: the result is nominally significant, but the confidence interval is wide enough that the "true" lift could be barely above zero or as high as 10% — you don't have enough data to know which.
Business Interpretation
A +5.2% relative lift on checkout conversion is commercially meaningful if real — at your traffic volume that's roughly 60 incremental orders per day. But the wide confidence interval means you're not choosing between "ship" and "don't ship," you're choosing between "possibly a strong winner" and "possibly noise." The guardrail metric (average order value) held flat at -0.3% (not significant), so there's no evidence the variant is cannibalizing basket size to win on conversion rate. No red flags there.
Recommendation: HOLD
Extend the test by at least 7-10 more days to reach ~80% power at the observed effect size (approximately 34,000 sessions per arm). The 14-day window also only covers two weekly cycles, borderline for ruling out a novelty effect on a redesigned flow — extending the window addresses both the power problem and the novelty-effect risk simultaneously. Shipping now on a 52%-powered result risks locking in a false positive that erodes checkout conversion once the novelty wears off.
Caveats & Follow-Up
Check whether the lift is concentrated in mobile vs. desktop traffic — redesigns often show device-specific effects that average out misleadingly. Also confirm the test wasn't peeked at and stopped early; if the 14-day window was chosen after seeing early results trending positive, treat this read with additional skepticism and weight the extension recommendation even more heavily.
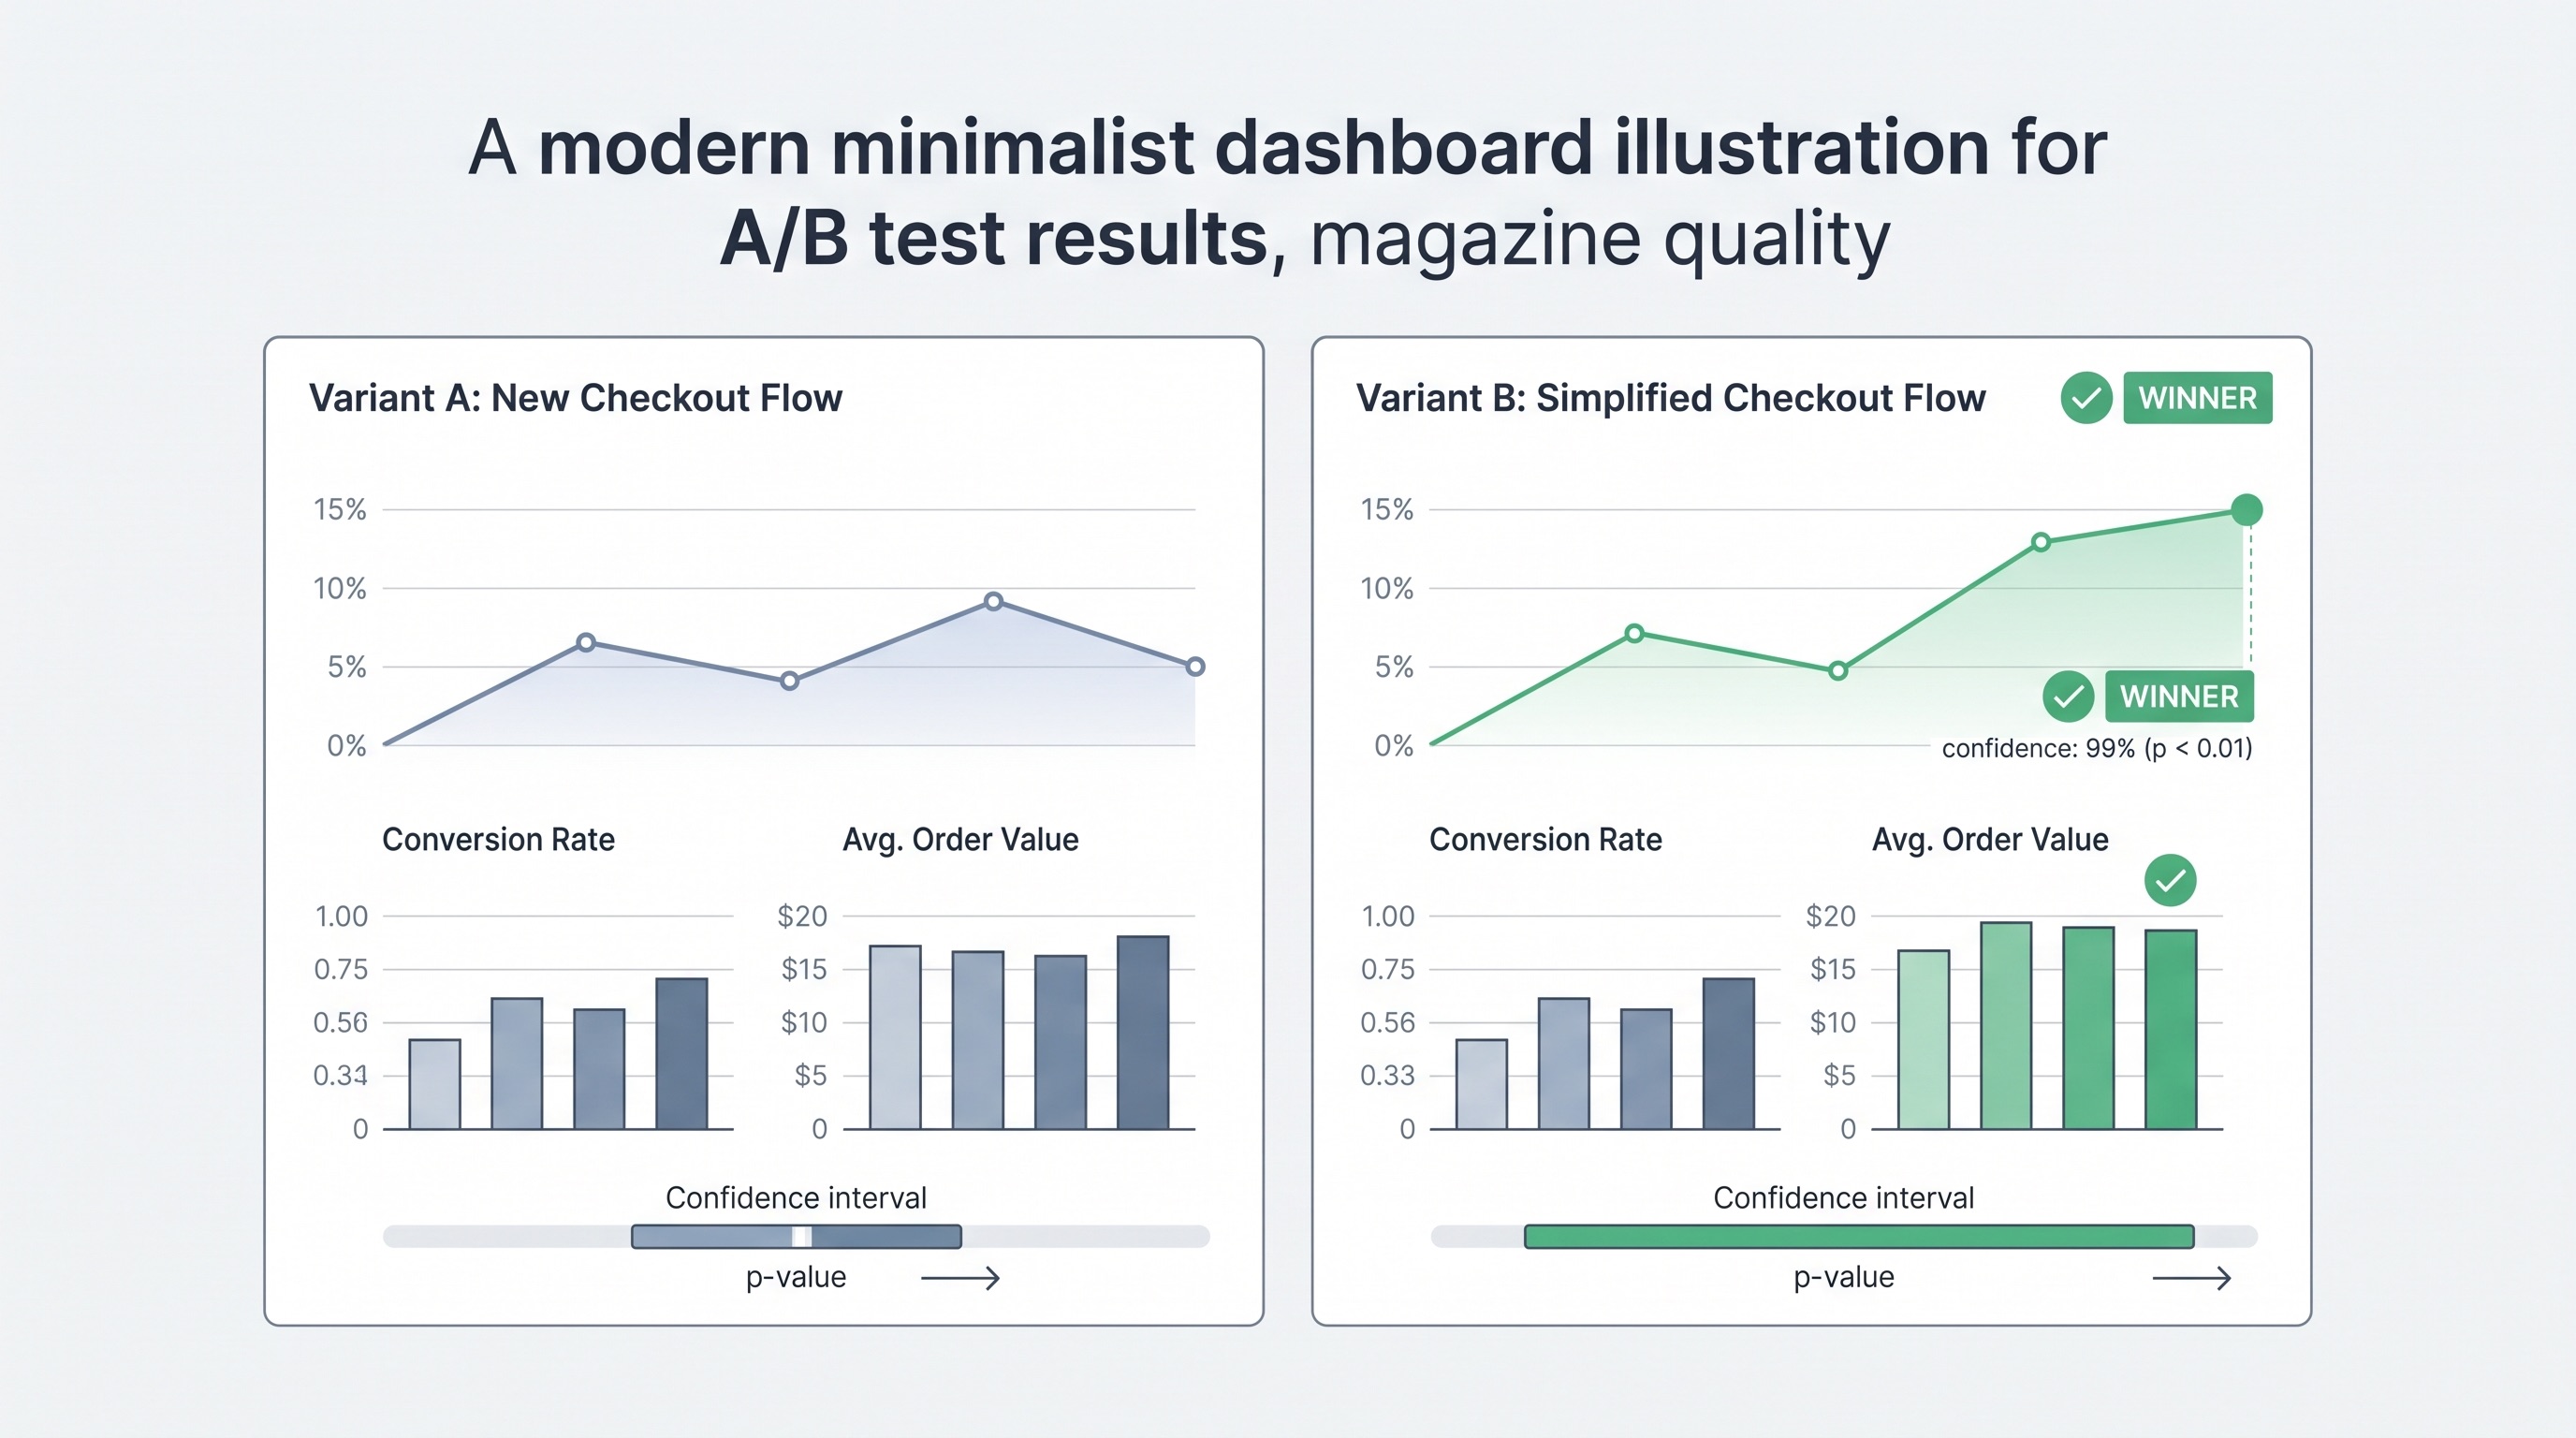
Die meisten Teams lesen ein A/B-Testergebnis auf die gleiche Weise: Kontrollzahl, Variantenzahl, die höhere gewinnt. So werden falsch-positive Ergebnisse ausgeliefert und so werden echte Gewinner von nervösen Stakeholdern getötet, die eine kleine Stichprobe sehen und verunsichert sind. Dieses Prompt existiert, um fünf Prüfungen zu erzwingen, die ein Dashboard-Blick überspringt — Signifikanz, Power, praktische Signifikanz, Guardrail-Regressionen und Bias-Risiken wie Neuheitseffekte und frühes Spicken — bevor sich jemand auf eine Starten/Halten/Verwerfen-Entscheidung festlegt.
Warum die Struktur funktioniert
Der Abschnitt Kontext fragt bewusst zuerst nach Stichprobengrößen und Testdauer, nicht nur nach den Hauptkennzahlen. Signifikanz- und Power-Berechnungen sind ohne sie bedeutungslos, und genau diese Informationen lassen die meisten Leute weg, wenn sie „Kontrolle war 4,8 %, Variante war 5,05 %“ in ein Chat-Fenster einfügen und ein Urteil erwarten.
Der Abschnitt Einschränkungen ist der Ort, an dem der wahre Wert liegt. Das explizite Verbot einer „Starten“-Empfehlung bei einem unterpowerten Ergebnis stoppt den häufigsten Fehlermodus: einen Test, der nominale Signifikanz (p knapp unter 0,05) erreichte, aber nie lange genug lief, um eine vertrauenswürdige Stichprobengröße zu erreichen. Die Neuheitseffekt-Markierung erfasst Redesigns und UI-Änderungen, die eine Metrik vorübergehend ansteigen lassen, weil Benutzer auf etwas Neues reagieren, nicht weil die Änderung tatsächlich besser ist — eine Unterscheidung, die nur dann sichtbar wird, wenn der Test lange genug läuft, um mehrere vollständige Nutzungszyklen abzudecken. Die Spick-Bias-Markierung adressiert eine bekannte statistische Falle: Teams, die Ergebnisse täglich überprüfen und den Test stoppen, sobald er gut aussieht, führen effektiv Dutzende versteckter Hypothesentests durch, was die Falsch-Positiv-Rate weit über die nominalen 5 % aufbläht.
Der Abschnitt Ausgabeformat trennt absichtlich die „Statistische Lesart“ von der „Geschäftlichen Interpretation“. Ein p-Wert von 0,03 bedeutet einem VP in einer Roadmap-Überprüfung nichts — aber „es gibt eine echte Chance, dass dieser Anstieg nahe Null liegt“ schon. Die Trennung zwingt das Modell, die Statistiken in einen entscheidungsnutzbaren Satz zu übersetzen, anstatt bei der Zahl stehenzubleiben.
Wie man es gut nutzt
Füllen Sie die Felder in Klammern direkt aus dem Export Ihrer Experimentierplattform aus — runden Sie die Zahlen nicht von Hand, da die Power-Berechnung von den tatsächlichen Stichprobengrößen abhängt. Wenn Sie keine formale Guardrail-Metrik definiert haben, schreiben Sie „keine verfolgt“ anstatt sie leer zu lassen — diese Lücke ist es wert, in der Ausgabe hervorgehoben zu werden, da das Ausliefern auf Basis einer einzelnen Metrik ohne Gegenprüfungen ein eigenes Risiko darstellt.